Lead
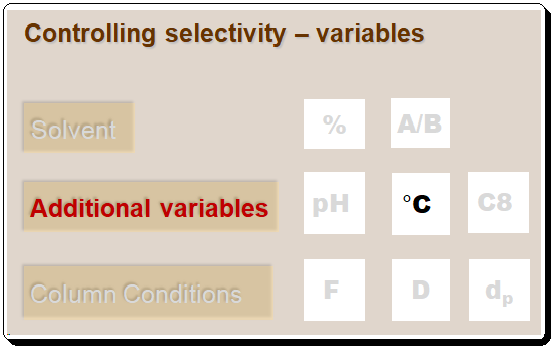
In the earliest posts we saw the how solvent concentration and type are powerful tools for controlling separation and also discussed these variables alone may not be sufficient for achieving the desired sample resolution. In such cases chromatographers may seek to employ other parameters to adjust selectivity viz..
- pH; temp.; column selectivity – C8/C18/PH/CN/NH2
- Ion-pair reagents; CDAs, etc.
- Vary modes of chromatography: IE; NP; or SE
In the last post the discussion was focused on the influence of pH on selectivity. In this blog the focus will be on the effect of temperature on selectivity.
Column Temperature
A gist of the influence of column temperature on selectivity is presented below.
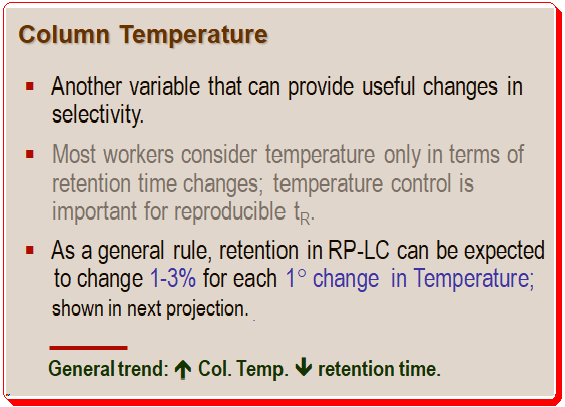
This rule is depicted in Figure 1; retention changes approximately 25% (19 min to 25 min for the last peak) with a 15 °C change in temperature, or approximately 0.7% per °C. The conditions for this separation are – Column: C8; 250mm x 4.6 mm; 5µm dp; Flow rate: 1 ml/min; Methanol (%): 35%; Buffer: 25 mM phosphate; pH: 3.2. In each circumstance, only the temperature is altered. Controlling the temperature is essential for reproducible retention times.
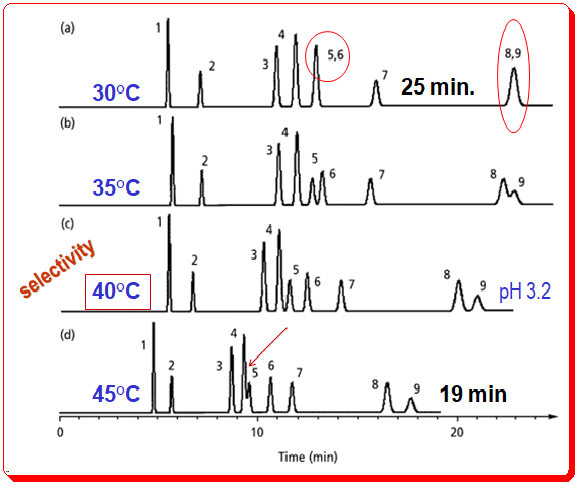
The fact that changes in temperature can affect the selectivity of LC separations is underappreciated. This condition is depicted in Figure 1 for the identical benzoic acid sample depicted in Figure 2 (in the earlier post). .
Despite the general trend towards shorter retention times as column temperature increases, significant changes in selectivity also occur. Observe how peak 5 shifts as the temperature rises, from coelution with peak 6 at 30 °C (indicated by a red circle) to beginning to merge with peak 4 at 45 °C (shown by a red arrow). Since peaks shift in a predictable manner in response to changes in mobile-phase conditions, peaks 4 and 5 would completely overlap at temperatures greater than 45 °C (overlap is complete at 53 °C). Peaks 8 and 9 also shift relative to one another when the column temperature is altered and co-elutes at temperature 30 °C (indicated by a red oval circle). For this sample, a temperature of 40 °C provides an optimal baseline separation of all the analytes.
Why does temperature cause such dramatic changes in the analytes selectivity? Changes in this case are largely attributable to the ionic nature of the sample. Temperature will affect the ionization characteristics, hydrophobic retention of ionized versus nonionized compounds, silanol interactions with ionic species, pH of the mobile phase, and pKa of sample components. It would be surprising if a change in temperature did not affect selectivity given all of these factors. The practical outcome for this sample of benzoic acid is that workers can achieve a satisfactory separation under multiple conditions. The similarity between Figure 2b’s pH 3.0 (35 °C) earlier post and Figure 1c’s pH 3.2 (40 °C), in the current post, runs is striking. Both conditions allow for the separation of all components in about 25 minutes. When ionic species are present in the sample, the temperature of the column and the pH of the mobile phase will have a significant effect on peak spacing.
For a detailed treatment of any of the above concepts consult books/articles suggested in the “Further reading” section.
Acknowledgment
The author wishes to acknowledge the use of simulated chromatogram from reference 3, has no intellectual property rights over the material, and has resorted to using it for educational and training purposes.
Disclaimer
Due to the field’s quick development, there may have been some unintentional omissions or inadequate technical specifications. If any omissions or updates needing to be made are added, we would be pleased to include them. To draw attention to it, kindly write a comment. All technical specifications found here are reproduced as-is from the manufacturer’s literature and might have changed at the time of publication. All information given here is for furthering science and cannot be construed as professional advice.
Further reading
1. Lloyd R. Snyder, Joseph J. Kirkland, Joseph L. Glajch, Practical HPLC Method Development, pages. 600-615, 1997, John Wiley & Sons, Inc. ISBN 0-471-00703-X
2. Lloyd R. Snyder, Joseph J. Kirkland, John W. Dolan Introduction to Modern Liquid, Chromatography, 3rd ed., Wiley 2009. ISBN: 978-0-470-16754-0
3. John W. Dolan, LCGC, 2000, 18(3), 286-293.
4. John W. Dolan, LCGC, 2000, 18(2), 118-125.
5. John W. Dolan, LCGC, 2000, 18(1), 28-32.
6. John W. Dolan, LCGC, 1999, 17(12), 1094-1097.
7. John W. Dolan and Lloyd R. Snyder, Troubleshooting LC systems: A comprehensive approach to troubleshooting LC equipment and separations, 1989, Humana Press, Inc., New Jersey. ISBN 0-89603-151-9.
8. Henrik Rasmussen (Editor), Satinder Ahuja (Editor), HPLC Method Development for Pharmaceuticals: Volume 8 (Separation Science and Technology), 2007, Academic Press Inc, ISBN-13 : 978-3527331291.
9. https://chiralpedia.com/blog/selecting-the-tools
10. https://chiralpedia.com/blog/measuring-quality-of-chromtogram-tools-1.0/
11.. https://chiralpedia.com/blog/measuring-quality-of-chromatogram-tools-2-0/
12. https://chiralpedia.com/blog/measuring-quality-of-chromatogram-tools-3-0/
13. https://chiralpedia.com/blog/controlling-selectivity-solvent-role-1-0/
14. https://chiralpedia.com/blog/controlling-selectivity-solvent-role-2-0/
15. https://chiralpedia.com/blog/controlling-selectivity-additional-factors-1-0-ph/