Lead
In the previous post the influence of solvent concentration and solvent type on the selectivity of liquid chromatography (LC) separations was discussed. We saw by systematically altering the solvent concentration, chromatographers can achieve dramatic changes in selectivity and retention. Changing the solvent type during method development, from acetonitrile to methanol, for instance, provided additional selectivity leverage. In some instances, it is advantageous to combine multiple organic solvents. Although varying solvent concentration and type are powerful tools for controlling separation, they may not be sufficient for achieving the desired sample resolution. In such cases the chromatographers may use other parameters to adjust selectivity viz..
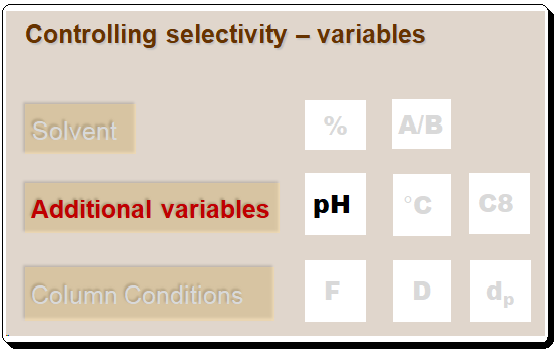
- pH; temp.; column selectivity – C8/C18/PH/CN/NH2
- Ion-pair reagents; CDAs, etc.
- Vary modes of chromatography: IE; NP; or SE
In this blog the focus will be on pH in addition to the previously discussed parameters.
Mobile-phase pH
For separations discussed in previous parts of this series, it is suggested to employ aqueous-organic solvent mobile phases in which the aqueous portion consisted of water for neutral samples or low-pH buffer for ionic samples. Using low-pH mobile phases (pH 2-3) is a good starting point because these conditions inhibit the ionization of acidic compounds as well as the residual silanol groups on the silica surface. However, when ionic compounds are present, pH can have a significant effect on retention and selectivity, so if the initial low-pH mobile phase is unsatisfactory, the next logical step in method development is to investigate pH effects.
Figure 1 demonstrates the influence of pH on selectivity.
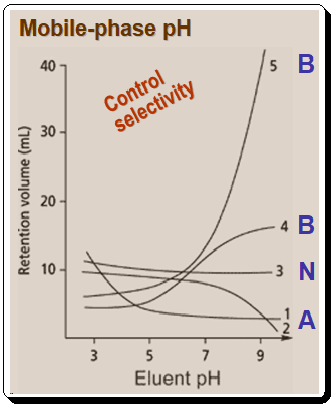
- Acids will be protonated, hydrophobic, and thus more strongly retained at low pH than at high pH in RP system.
- Bases will be neutral and will be retained at high pH, whereas low pH results in ionization and poor retention in RP system.
- Neutral compounds are unaffected by pH, so retention will vary little, if all, when MP pH is changed.
The above Figure also illustrates the following aspects:
As the above plot depicts, when the pH is altered, a mixture of acids (A), bases (B), and neutrals (N) will cause numerous retention reversals, This effect can be a potent tool for controlling selectivity and achieving separations that would be impossible to achieve by adjusting other parameters. The graph also indicates that chromatographers must take care to control pH and prevent unintended changes in selectivity. Figure 1 demonstrates that for maximum method robustness, it is optimal to work at a pH where the compound or compounds of interest are either fully ionized or ionization is suppressed. This condition requires chromatographers to operate at pH values greater than +/- 1.5 pH units from the pka value.
As mentioned previously, for majority of the ionic samples it is preferable to make the initial run with low pH, such as pH 2.5. For neutral and nonionized samples adjust the organic solvent concentration of the mobile phase to obtain a good retention range under these conditions. Chromatographers can alter the pH of the mobile phase while maintaining a constant organic solvent concentration in order to screen for pH’s broad effects. For instance, conduct an initial run at pH 2.5 and a second run at pH 7.0 to determine if significant changes occur. To fine-tune mobile-phase pH, however, it is best to vary the mobile phase in increments of no more than 0.5 pH units, as retention and peak spacing can be dramatically altered by small pH changes. These dramatic changes can make it difficult to track peaks, particularly if peak areas change, as can occur with pH changes.
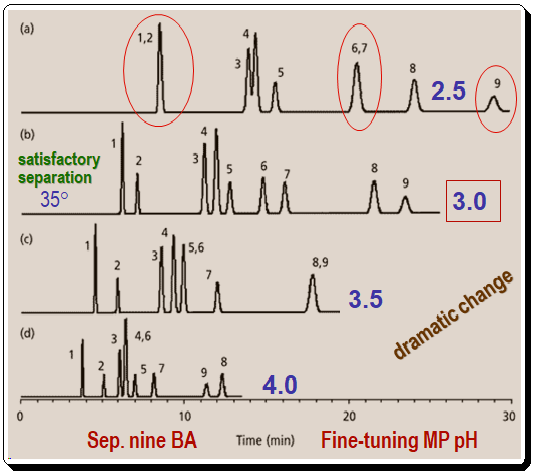
Figure 2 depicts a method for fine-tuning the pH of the mobile phase for a group of benzoic acids (BAs). The conditions for this separation are – Column: C8; 250mm x 4.6 mm; 5µm dp; Flow rate: 1 ml/min; Methanol (%): 35%; Buffer: 25 mM phosphate; pH: varies; Temperature: 35 °C . In each circumstance, only the pH is altered. When analyzing chromatograms such as those in this figure, it is advantageous to focus on the critical (least resolved) peak pairs. Compared to the other peaks in the sample, peaks 2, 6, and 9 shift dramatically. For instance at pH 2.5: peaks (1,2) and , (6,7) are merged; similarly at pH 3.5 you find peaks (5,6) and (8,9) are merged; also notice that at pH 4.0 the peaks (4,6) merged and peaks (8 & 9) inverted/reversed positions. At pH 3.0, the separation of all nine components is satisfactory. As expected for a group of organic acids, a decrease in pH reduces the degree of ionization and increases the hydrophobicity of the components, making them more strongly retained.
When using pH to control an LC separation, it is crucial to observe the fundamental buffer usage rules.
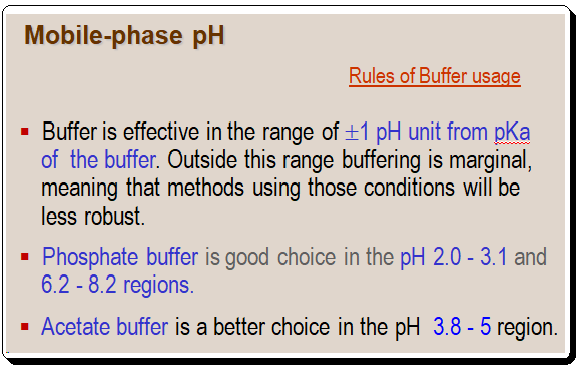
Although the ideal buffering ranges for these two buffers do not overlap, by extending the range of each buffer by less than 0.5 units, a blend of acetate and phosphate can be used to create a buffer that is effective from pH 2 to 8.
The other factors viz. temperature and column selectivity will be discussed in the upcoming post <Controlling selectivity- Additional factors -2.0/3.0>
For a detailed treatment of any of the above concepts consult books/articles suggested in the “Further reading” section.
Acknowledgment
The author wishes to acknowledge the use of simulated chromatogram from reference 3, has no intellectual property rights over the material, and has resorted to using it for educational and training purposes.
Disclaimer
Due to the field’s quick development, there may have been some unintentional omissions or inadequate technical specifications. If any omissions or updates needing to be made are added, we would be pleased to include them. To draw attention to it, kindly write a comment. All technical specifications found here are reproduced as-is from the manufacturer’s literature and might have changed at the time of publication. All information given here is for furthering science and cannot be construed as professional advice.
Further reading
1. Lloyd R. Snyder, Joseph J. Kirkland, Joseph L. Glajch, Practical HPLC Method Development, pages. 600-615, 1997, John Wiley & Sons, Inc. ISBN 0-471-00703-X
2. Lloyd R. Snyder, Joseph J. Kirkland, John W. Dolan Introduction to Modern Liquid, Chromatography, 3rd ed., Wiley 2009. ISBN: 978-0-470-16754-0
3. John W. Dolan, LCGC, 2000, 18(3), 286-293.
4. John W. Dolan, LCGC, 2000, 18(2), 118-125.
5. John W. Dolan, LCGC, 2000, 18(1), 28-32.
6. John W. Dolan, LCGC, 1999, 17(12), 1094-1097.
7. John W. Dolan and Lloyd R. Snyder, Troubleshooting LC systems: A comprehensive approach to troubleshooting LC equipment and separations, 1989, Humana Press, Inc., New Jersey. ISBN 0-89603-151-9.
8. Henrik Rasmussen (Editor), Satinder Ahuja (Editor), HPLC Method Development for Pharmaceuticals: Volume 8 (Separation Science and Technology), 2007, Academic Press Inc, ISBN-13 : 978-3527331291.
9. https://chiralpedia.com/blog/selecting-the-tools
10. https://chiralpedia.com/blog/measuring-quality-of-chromtogram-tools-1.0/
11.. https://chiralpedia.com/blog/measuring-quality-of-chromatogram-tools-2-0/
12. https://chiralpedia.com/blog/measuring-quality-of-chromatogram-tools-3-0/
13. https://chiralpedia.com/blog/controlling-selectivity-solvent-role-1-0/
14. https://chiralpedia.com/blog/controlling-selectivity-solvent-role-2-0/