Lead
In the previous post, “Measuring quality of chromatogram – Tools 1.0” we talked about two of the separation attributes retention time and retention factor. In current post the discussion is on other features viz. peak asymmetry, peak shape, column plate number. and related aspects. This time let us try to answer the following queries to understand how these attributes also help to assess the quality of chromatogram.
- What is the first thing experienced chromatographer look for while examining chromatograms?
- What technique is used to measure peak shape?
- Ideally, what should be the shape of peaks?
- How to measure column efficiency or performance?
- What story does tailing of peaks tell us?
Peak asymmetry and peak tailing
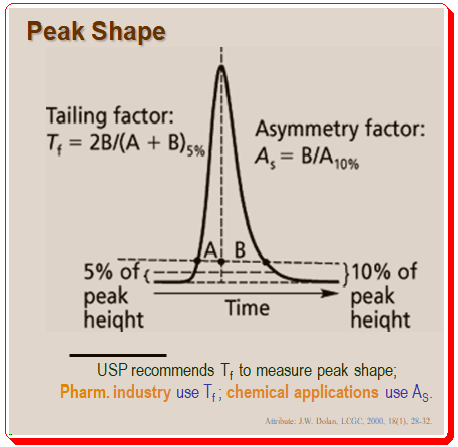
Peak shape is an important parameter in method development. The shape of the peaks is one of the first things experienced chromatographers look for when examining chromatograms. Although Gaussian-shaped chromatographic peaks are ideal, in reality most peaks exhibit some peak tailing. Usually the tailing factor in calculated using either the asymmetry factor (AS) or the U.S. Pharmacopeia (USP) tailing factor (Tf) as depicted in Figure 1.
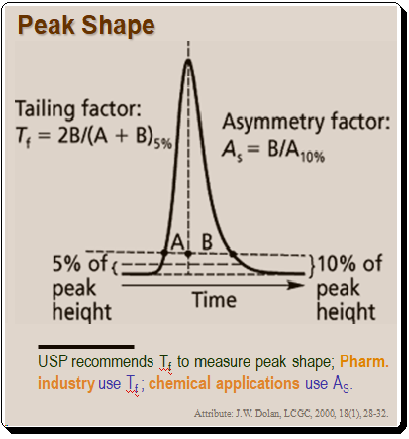
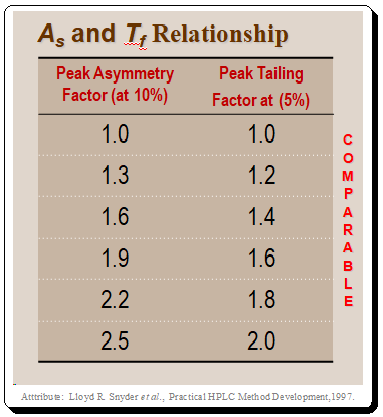
It is interesting to note that the pharmaceutical industry uses the USP tailing factor as a standard while the majority of other chemical applications employ AS to measure peak shape, . Practically, it doesn’t matter which measurement method you employ as long as you use it to gauge peak tailing. If tailing is minimal, the two measures are roughly comparable, as shown in the Table below.
When there is tailing of peak one need to understand that more one retention mechanism is operating in the interaction of that specific peak with the stationary phase. This is not a good sign. In such situations analysts are forced to use longer run times for baseline separations, and because some of the area is under the tail, the peak heights are smaller, that can compromise detection limits. Peak tailing can typically be reduced by using a column made of Type B silica and operated with a low-pH mobile phase. To lessen peak tailing, mobile-phase additives like triethylamine may occasionally be used.
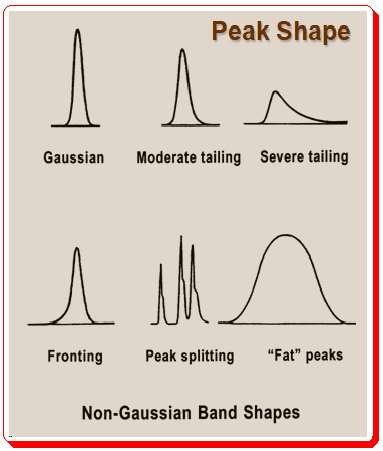
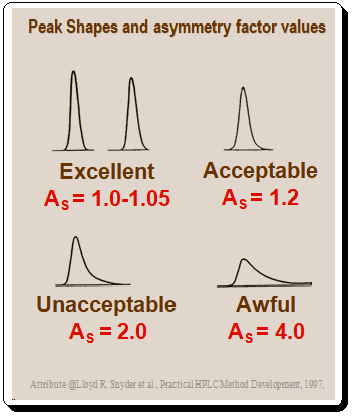
Peak shapes and asymmetry factor values
Peaks with poor symmetry can result in a range of peak shapes and asymmetric factor values represented in the Figure 2.1 (Peak shape) and 2.2 (Peak shape and AS factor values) below.
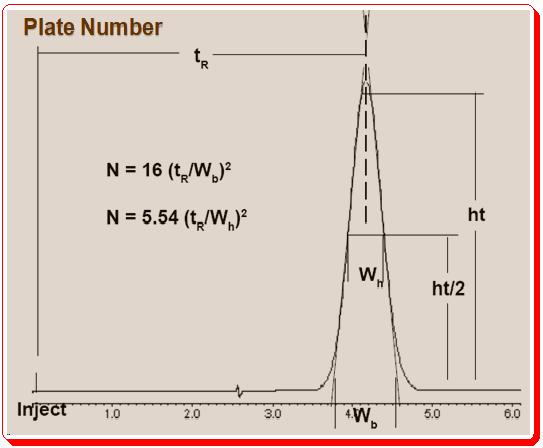
Column Plate Number (N) and measuring
The column plate number (N) is an important characteristics of a column. ‘N’ reflects column efficiency/performance. To ascertain whether the column is operating in a reasonable manner, it is crucial to look at the peak width in addition to peak shape. Peak width can be expressed as a function of time, but the plate number (N) is a more practical way to measure peak width. Most analysts prefer to use the half-height method, in which they divide N by the width at half the peak’s height, to calculate the plate number as depicted in Figure 3. If the baseline is noisy, if the peak tails, or if it is not completely separated from neighboring peaks, it is easier to calculate the width at half-height than at the baseline.
Estimation of column plate number:
Using the test conditions specified by the column manufacturer, a new column with 5-μm particles will produce roughly 80,000 plates/m, whereas a column with 3-μm particles will produce roughly 100,000 plates/m. When the column is brand-new, these measurements made under controlled test conditions are helpful in determining whether it passes initial quality tests. However, this testing is inconvenient when the column is in regular use. Furthermore, under typical operating conditions, the test compounds used by column vendors frequently provide N values that are significantly higher than real compounds. It is much more practical to test the column while it is being used, and acceptable performance can be confirmed by using a system-suitability sample. For these reasons, the place number can be estimated as per the following equation.
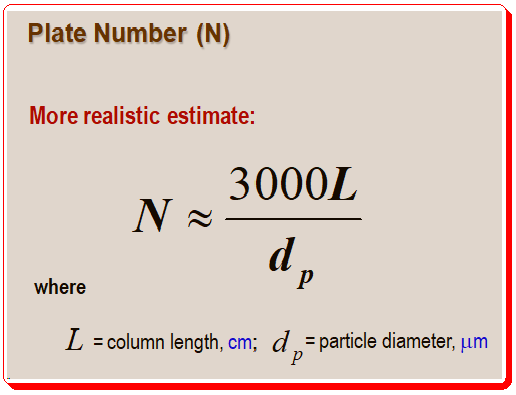
Hence, under realistic operating conditions, a 150-mm column containing 5-μm particles should have a plate number of about 9000. One should check the chromatogram’s peaks for reasonable plate numbers using this rule of thumb. Chromatographers should take corrective action if a peak of interest’s plate number is more than 20% below the recommended range of the equation (depicted in Figure 4).
Factors increasing column plate number:
- Well-packed columns
- Column length (increase)
- Flow rates (lower but not too low)
- Column packing particles (smaller)
- Mobile phase viscosity (lower)
- Temperature (higher)
- Analyte molecules (smaller)
- Extracolumn effects (minimal)
Column lifetime:
All the columns are destined to “die” eventually. One can sense the aging of a column by looking at the features like plate number, asymmetric value, and resolution (resolution will be discussed in the next post). Increased peak asymmetry value, AS, to > 1.5 may be taken as an alert to change the column. Sometimes rejuvenation of column are also attempted.
Selectivity Factor (α)
Describes relative position of two adjacent peak maxima; reflects relative interactions of solutes 1 & 2. Separation/selectivity factor is defined as ratio of k-values for adjacent peaks; α = k2/k1; i.e., ratio of time each each component spends on the stationary phase.
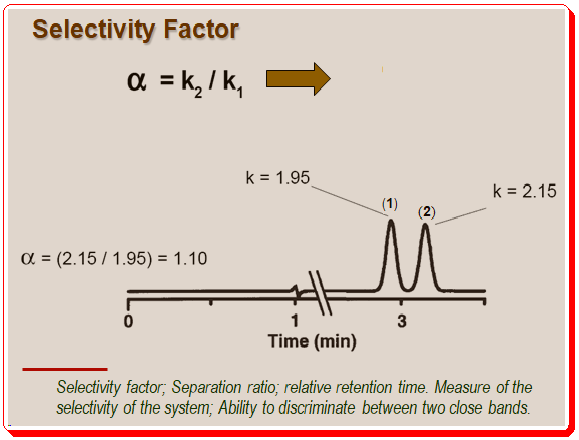
By definition k2 > k1. By convention, α ≥ 1.0; the shortcoming by using α to measure separation is that it does not take the band width into account.
Control selectivity:
Selectivity can be controlled by manipulating any of the following chromatographic variables.
- Mobile phase chemistry – solvent -functionality
- Stationary phase – packing – functionality
- Analyte chemistry – H-bonding or derivatization
Sum up
So you now have three tools at your disposal to assess the quality of a chromatogram. In order to determine whether retention is in the area most likely to result in a successful separation, you must first calculate the k values for the first and last peaks in the chromatogram. Next, look at each peak individually to see if it is well-shaped and if the peak widths are appropriate. The likelihood of a successful separation will be increased if the peaks are well behaved, which will be determined by this set of measurements. These observations on the chromatogram are important, but the main objective of chromatography is to achieve a good separation. To decide whether the separation of the analyte is suitable you need to take one more measurement, namely the resolution, . Resolution as a tool will be dealt in detail in the forthcoming post (Measuring quality of chromatogram- Tools 3.0)
For a detailed treatment of any of the above concepts consult books/articles suggested in the “Further reading “section.
Disclaimer
Due to the field’s quick development, there may have been some unintentional omissions or inadequate technical specifications. If any omissions or updates needing to be made are added, we would be pleased to include them. To draw attention to it, kindly write a comment. All technical specifications found here are reproduced as-is from the manufacturer’s literature and might have changed at the time of publication. All information given here is for furthering science and cannot be construed as professional advice.
Further reading
1. Lloyd R. Snyder, Joseph J. Kirkland, Joseph L. Glajch, Practical HPLC Method Development, pages. 600-615, 1997, John Wiley & Sons, Inc. ISBN 0-471-00703-X
2. Lloyd R. Snyder, Joseph J. Kirkland, John W. Dolan Introduction to Modern Liquid, Chromatography, 3rd ed., Wiley 2009. ISBN: 978-0-470-16754-0
3. John W. Dolan, LCGC, 2000, 18(1), 28-32.
4. John W. Dolan and Lloyd R. Snyder, Troubleshooting LC systems: A comprehensive approach to troubleshooting LC equipment and separations, 1989, Humana Press, Inc., New Jersey. ISBN 0-89603-151-9.
5. Henrik Rasmussen (Editor), Satinder Ahuja (Editor), HPLC Method Development for Pharmaceuticals: Volume 8 (Separation Science and Technology), 2007, Academic Press Inc, ISBN-13 : 978-3527331291
6. https://chiralpedia.com/blog/selecting-the-tools
7. https://chiralpedia.com/blog/measuring-quality-of-chromtogram-tools-1-0/