Lead
In the previous post, we talked about choosing suitable initial conditions when developing a new liquid chromatography (LC) method. The possibility of a successful separation is increased by selecting the appropriate column conditions and mobile phase composition. Getting the controls that quantitatively measure the separation’s quality is another crucial step in the method development process. Although the majority of chromatographers are able to assess the separation quality from a chromatogram, it is critical to be able to quantify the separation quality. This measurement capability is significant because it enables chemists to evaluate the separation when deliberate or accidental changes take place. The separation attributes include retention time, retention factor, peak shape, column plate number, and resolution. In the entire LC method development process, starting from the initial injection to the final stages of method validation and application, the quantitative measurements of separation quality is crucial. For convenience of the readerships and not to make the post too lengthy, I have split “Measuring quality of chromatogram” into three sections namely Tools 1.0, 2.0 and 3.0. In this post the focus will be on Tools 1.0, retention time and retention factor.
Retention time (tR)
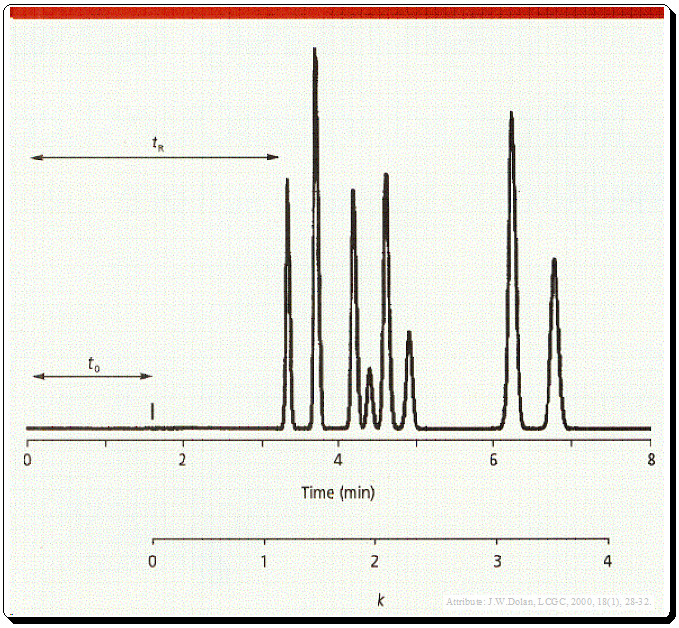
The time between the injection of the sample and the peak’s apex is known as the retention time (tR) (Figure 1) and probably the most commonly used chromatographic parameter. It is distinctive in that an analyte will always elute at the same time in every run if all other factors remain constant. Hence, retention time is frequently employed as a qualitative compound identification tool.
It is likely that the two compounds are the same if a standard of the substance is injected and the retention time matches the peak in the sample. However, because multiple compounds can elute at the same retention time, retention is not a singular phenomenon. The possibility of co-elution is the challenge in LC separation.
Let us take a brief pause and look at the column dead volume which is an important term while computing retention factor and in method development exercises.
Column dead time (t0)
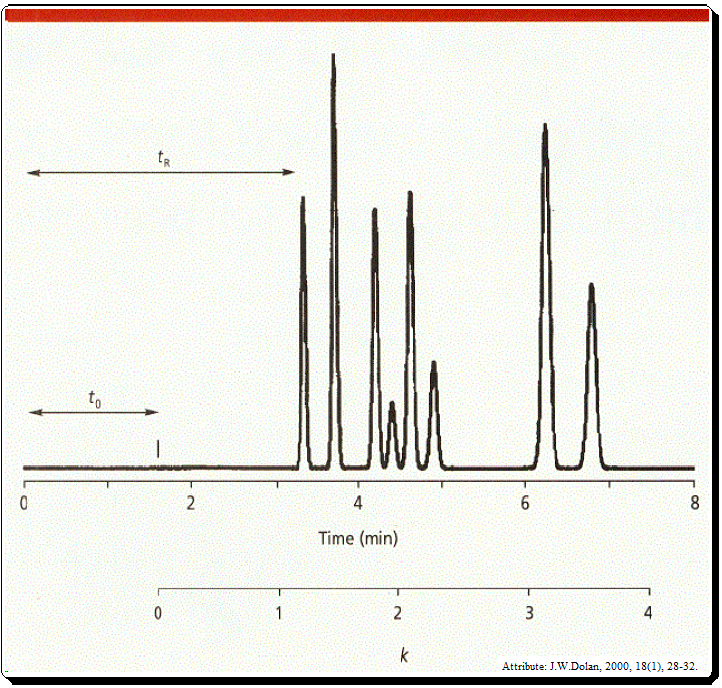
t0 is the column dead time, usually noted by the first disturbance in the base line or the elution of a solvent peak (Figure 1 and 2).
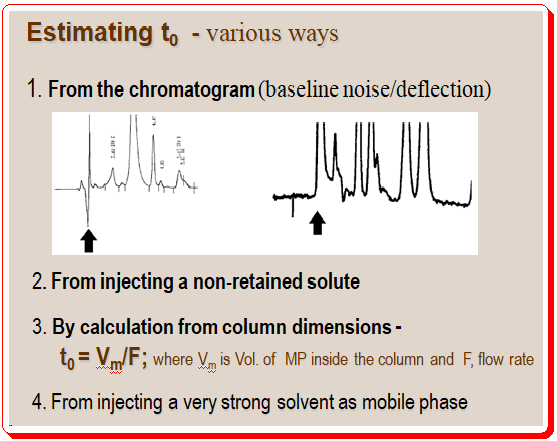
Estimating value of t0 :
It is important to get an approximate value of t0 for the HPLC system especially in evaluating successive method development experiments. There are various approaches to estimate the value of t0 .
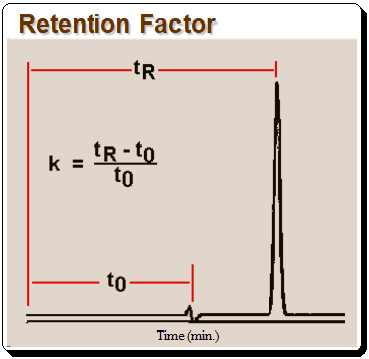
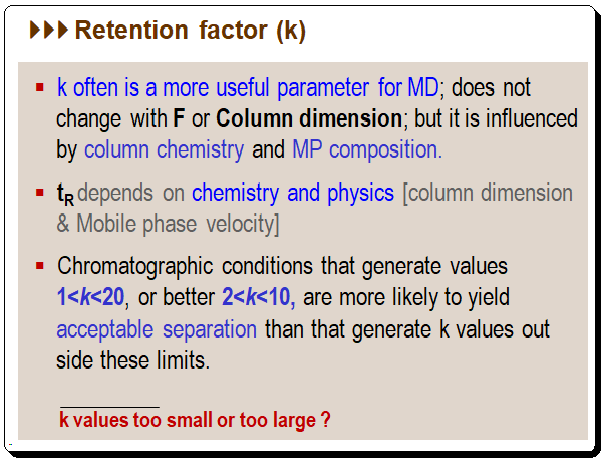
Retention Factor (k)
The retention factor (k) is probably the most used chromatographic parameter method development, Other synonyms include capacity ratio; capacity factor; retention ratio; partition ratio. The retention factor reflects the quality of separation and is a vital tool for analyst. For instance, chromatographic conditions that yield k values of 1 < k < 20, or even better, 2 < k < 10, are more likely to result in a separation that is acceptable than conditions that yield k values outside of these limits. Chromatographers are aware from experience that if k is too large, peaks become broad and difficult to detect, and the run time is excessive; if k is too small, peaks get crowded together and consequently peak of interest tend to have problems with interferences at the injection front.
Calculation of k value:
The k value can be calculated from equation depicted in Figure 1 where tR is retention time and t0 is the column dead time.,
It should be noted that k, as defined in equation in Figure 2, is useful only for isocratic separation, where the composition of the mobile phase is fixed.
Estimation of k value:
Even though k can be calculated, it is typically simpler to estimate its value, and an estimate is sufficient for method development. Remember that the corrected retention time, the amount of time after t0 necessary for the peak to be eluted, appear in the numerator of equation 1. The denominator defines the units of k -units of t0. Therefore, to estimate t0, simply begin measuring at t0 and determine how many t0 units are needed to elute the peak. This measurement is shown in Figure 1 below the time axis. Three t0 units have passed since the peak that was eluted at six minutes, so the approximate k value is three. If k is estimated within 0.5–1 units, it will be acceptable for method development purposes.
Retention factor / Retention time – Summary:
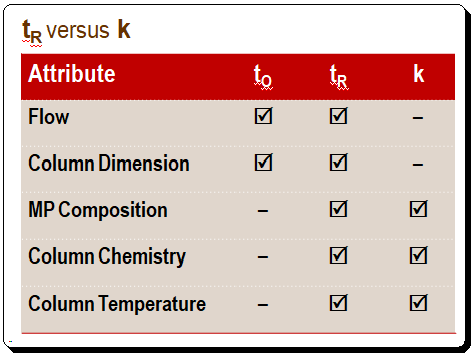
Retention time (tR) and Retention factor (k): Comparison
A comparison of the affects of various attributes on tR and k is presented in the Table below. Changes in the flow rate and column size directly affect retention time, whereas k stays constant when either of these parameters changes. When the mobile-phase composition or column temperature changes, tR and k also change. Thus, anything that affects to and tR proportionally will not affect k. What are the implications of this situation in terms of practice? After you achieve a desired separation on one column, you can change to a column of different dimensions, even if the flow rate is changed, and the k value will remain unchanged. Meaning that the quality of the separation, in terms of retention, remain unchanged.
While studying a chromatogram one should quickly judge the k values of the first and last peak to check whether they fall within the 1 < k < 20 range. A change in the composition of the mobile phase might be required to achieve a satisfactory separation if the peaks are crowded together at the beginning (small values of k) or is strongly retained (large k values).
For a detailed treatment of any of the above concepts consult books/articles suggested in the “Further reading” section.
Disclaimer
Due to the field’s quick development, there may have been some unintentional omissions or inadequate technical specifications. If any omissions or updates needing to be made are added, we would be pleased to include them. To draw attention to it, kindly write a comment. All technical specifications found here are reproduced as-is from the manufacturer’s literature and might have changed at the time of publication. All information given here is for furthering science and cannot be construed as professional advice.
Further reading
1. Lloyd R. Snyder, Joseph J. Kirkland, Joseph L. Glajch, Practical HPLC Method Development, pages. 600-615, 1997, John Wiley & Sons, Inc. ISBN 0-471-00703-X
2.Lloyd R. Snyder, Joseph J. Kirkland, John W. Dolan Introduction to Modern Liquid, Chromatography, 3rd ed., Wiley 2009. ISBN: 978-0-470-16754-0
3. John W. Dolan, LCGC, 2000, 18(1), 28-32.
4. John W. Dolan and Lloyd R. Snyder, Troubleshooting LC systems: A comprehensive approach to troubleshooting LC equipment and separations, 1989, Humana Press, Inc., New Jersey. ISBN 0-89603-151-9.
5. Henrik Rasmussen (Editor), Satinder Ahuja (Editor), HPLC Method Development for Pharmaceuticals: Volume 8 (Separation Science and Technology), 2007, Academic Press Inc, ISBN-13 : 978-3527331291