
Lead
In the last post we saw the tools at your disposal to assess the quality of a chromatogram viz. retention factor, peak asymmetry, peak shape, column plate number, and related aspects. These chromatogram observations are important, but the main purpose of chromatography is to achieve a separation that is reasonable. To ensure whether the separation is satisfactory one need to add one more measurement to the tool box namely the resolution. In this post the focus will be on this separation attribute resolution.
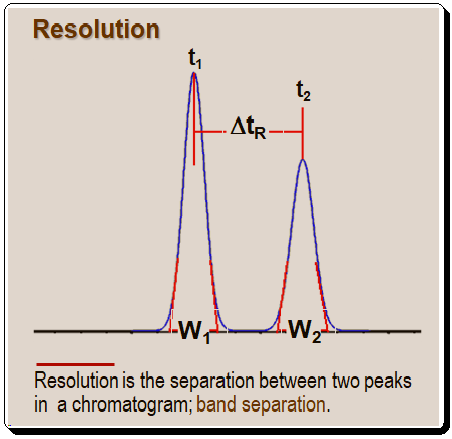
Resolution
Resolution, which is referred to as the distance between two peaks in a chromatogram, is where w1 and w2 are the baseline widths of two peaks, and t1 and t2 are the retention times.
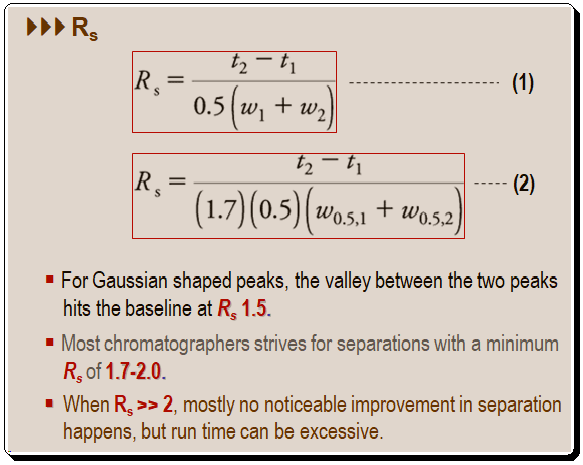
Equation to calculate resolution
Basically equations (1) and (2), depicted below, are good tools for measuring resolution. The half-height peak widths are used in an alternative formula [equation (2)], where w0.5,1 and w0.5,2 are the half-height peak widths of peak 1 and 2.
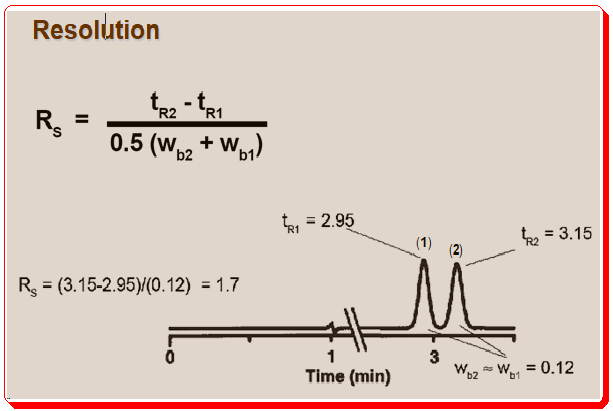
The following is an illustration showing the measurement of resolution using half-height peak widths method.
Although equations (1) and (2) are useful for measuring resolution, equation (3) shown below is a more useful and meaningful way to define resolution during method development process. In this equation resolution is expressed in terms of three parameters (N, α, and k) which are directly related to experimental conditions.
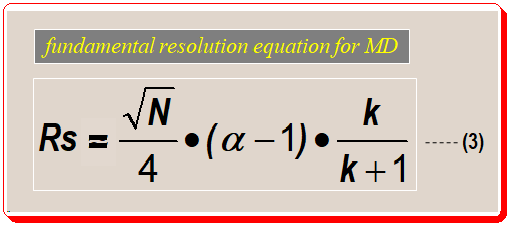
Decoding fundamental resolution equation:
Interestingly, the equation (3a), depicted below, groups most of the chromatographic experimental variables into three components/parts namely, column efficiency (i), selectivity (ii) and retentivity (iii). This enables systematic variation of experimental conditions to attain desired separation. Let us examine each of these parts separately and understand the impact of these factors on resolution.
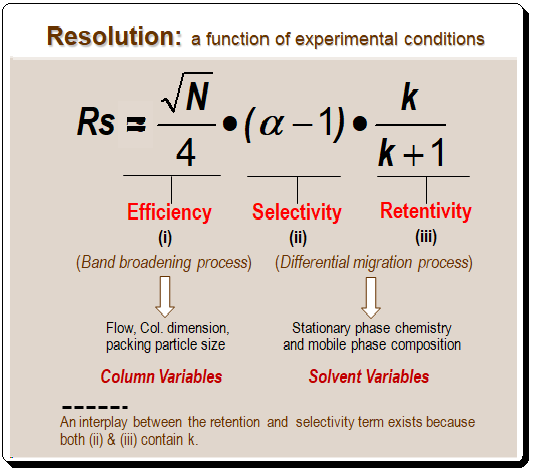
Component (i): reflects column efficiency
Part 1 concerns column quality. Higher plate number columns have better resolution. To double the resolution, chromatographers must increase N by four times because resolution only increases as the square root of the plate number. This change is not feasible. From first principles, the plate number can be calculated with ease, and it is simple to foresee how changes in particle size, column length, or flow rate will affect N. It is best to leave these changes until the end of the method development process because plate number changes can be predicted so easily. Choose a column to start with that will produce a respectable number of plates for most separations. . I would recommended a 150 mm x 4.6 mm, 5-m dp column as a good starting point. [Read more @ <https://chiralpedia.com/blog/selecting-the-tools/>.
Component (ii): reflects selectivity
Part (ii) of equation (3a) covers selectivity, or the capacity of the column-mobile phase combination to distinguish between two peaks. Selectivity is primarily influenced by chemical factors, but selectivity and retention are also closely related. Changes in selectivity are more challenging to predict than changes in plate number.
Component (iii): reflects retentivity
The retention term is found in part iii of equation (3a) (in iii, k is the average k value of the two peaks under consideration). Resolution improves as retention (or k) increases. Both terms contain k, so there is interaction between them; a change in k (iii) will typically change α in (ii) as well.
Sum up
In the in the first on HPLC method development, post “Selecting the tools” we discussed the significance of choosing a column and the mobile-phase conditions most conducive to a successful separation. Even though success in those circumstances is not guaranteed, there is a greater chance of doing so while spending the least amount of money on method development. Even though success in those circumstances is not guaranteed, there is a greater chance of doing so while spending the least amount of money on method development. In the next two posts “Measuring quality of chromatogram – 1.0 and 2.0” the focus was on the tools for evaluating the chromatogram’s quality. With the aid of these tools, you are able to analyze a chromatogram, perform a few calculations, and decide whether the separation is successful or not. Before developing a new method, issues with the fundamental chromatographic process should be fixed if a peak’s shape or column plate number is unsatisfactory. In general, chromatographers can modify the stationary- or mobile-phase conditions to change retention (k value) and resolution. With these resources at your disposal, you can start developing a method and use them to quickly achieve a good separation. In the next post let us look at how to use equation 3, as a guideline, to manage retention and selectivity.
For a detailed treatment of any of the above concepts consult books/articles suggested in the “Further reading” section.
Disclaimer
Due to the field’s quick development, there may have been some unintentional omissions or inadequate technical specifications. If any omissions or updates needing to be made are added, we would be pleased to include them. To draw attention to it, kindly write a comment. All technical specifications found here are reproduced as-is from the manufacturer’s literature and might have changed at the time of publication. All information given here is for furthering science and cannot be construed as professional advice.
Further reading
1. Lloyd R. Snyder, Joseph J. Kirkland, Joseph L. Glajch, Practical HPLC Method Development, pages. 600-615, 1997, John Wiley & Sons, Inc. ISBN 0-471-00703-X
2. Lloyd R. Snyder, Joseph J. Kirkland, John W. Dolan Introduction to Modern Liquid, Chromatography, 3rd ed., Wiley 2009. ISBN: 978-0-470-16754-0
3. John W. Dolan, LCGC, 1999, 17(12), 1094-1097.
4. John W. Dolan, LCGC, 2000, 18(1), 28-32.
5. John W. Dolan and Lloyd R. Snyder, Troubleshooting LC systems: A comprehensive approach to troubleshooting LC equipment and separations, 1989, Humana Press, Inc., New Jersey. ISBN 0-89603-151-9.
6. Henrik Rasmussen (Editor), Satinder Ahuja (Editor), HPLC Method Development for Pharmaceuticals: Volume 8 (Separation Science and Technology), 2007, Academic Press Inc, ISBN-13 : 978-3527331291
7. https://chiralpedia.com/blog/selecting-the-tools
8. https://chiralpedia.com/blog/measuring-quality-of-chromtogram-tools-1.0/
9. https://chiralpedia.com/blog/measuring-quality-of-chromatogram-tools-2-0/

A very concise and informative summary.
Thanks.
Concise information and worth explanation.
Thank you.