Lead
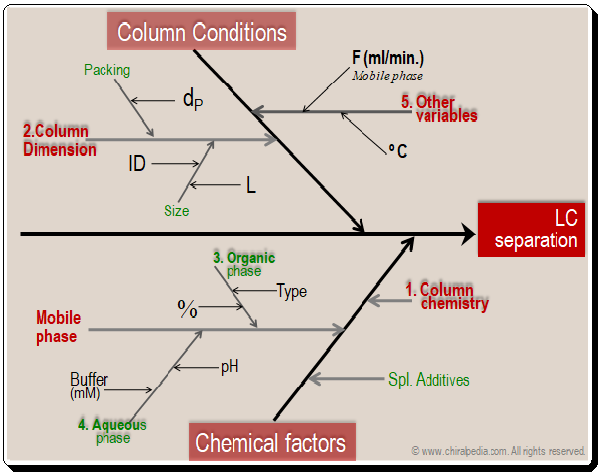
Starting out with a sound strategy is one of the most important aspects of minimizing chromatographic separation issues. A good method makes it much simpler to maintain operation within parameters and address issues as they appear. Selecting the right tools is very critical to achieve the best results,. By looking at the cause-and-effect diagram given below one can understand the factors that influence chromatographic separation.
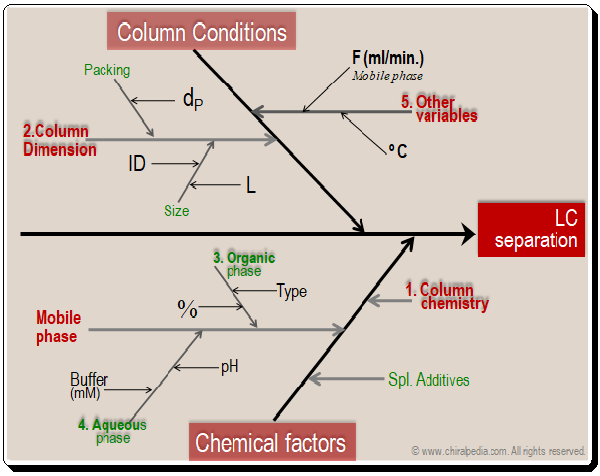
Basically the factors falls into two major categories namely column conditions (dimensions) and chemical factors (column chemistry, mobile phase components, additives, and etc.). Obviously they become the tools available in the HPLC MD kit that can be put to use in method development process
Column chemistry
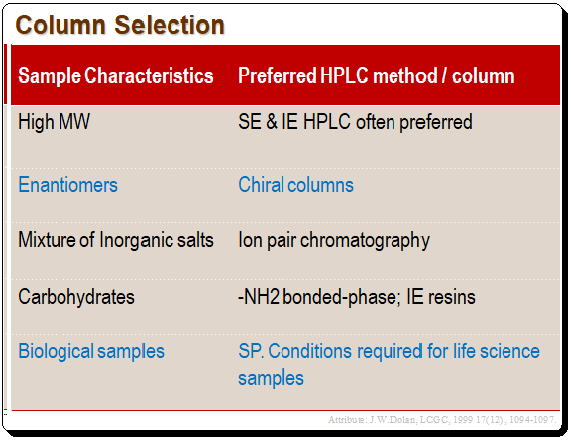
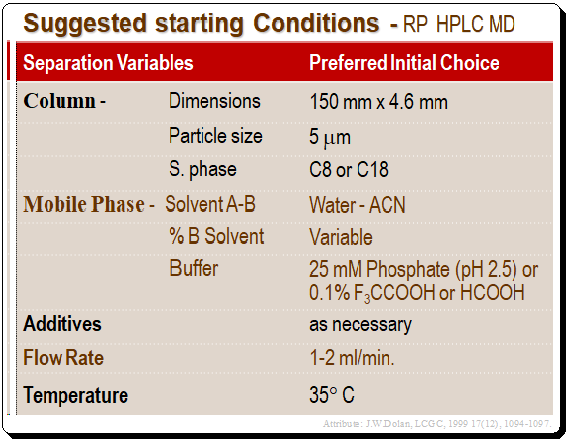
Column selection is one of the most crucial decisions in method development. The question is where do you begin when there are hundreds of columns available to chromatographers?. For instance, C8 and CI 8 phases are the most widely used reversed-phase columns in today’s LC separation processes. These two phases are so well-liked because they typically achieve the best stationary phase and the desired separation. The C8 and CJ8 phases are not sufficiently different from one another to strongly advise one over the other. In practice C18 is preferred over C8, but you can make your call on it. Reversed-phase separation will be effective for the majority of samples that the average chromatographer encounters. However, some compound types may need a different LC method. The sample and methods are presented in the Table below and is only a recommended starting points.
Column characteristics (dimension and packing particle size)
The column dimensions and packing particle diameter are another crucial decision (dp). Although 3.0 and 3.5-m particles are also widely used, 5-m dP particles are the most common size. Any of these particles are suitable for beginners, but due to their lengthy history of use, most chromatographers still favor the 5-m particles. Columns made of smaller particles have higher plate numbers but also generate higher back pressure. 150 mm X 4.6 mm column size is preferred since it produces a high enough plate number (N) with 5-m particles to achieve adequate separations with the majority of samples. The ability to set the flow rate at 1.5–2.0 ml/min in conjunction with manageable back pressures is an additional advantage of either of these column configurations. Higher flow rates obviously result in shorter run times. A few more plates are produced by columns as long as 250 mm, but this benefit is marginal (N only increases with the square root of length increase), and the drawbacks include longer run times and higher back pressures.
For initial screening, some workers recommend 30- or 50-mm column lengths, but these columns frequently fail to produce a high enough plate number for a practical separation. Microbore (less than 1 mm i.d.) or narrow-bore (2-rnm i.d.) columns are additional options. However, these columns require smaller sample volumes, less extra column plumbing, and smaller detector cell size and place unnecessary demands on the LC system during the method development stages. Hence it is preferable to use these short or narrow diameter columns during the fine-tuning phase of method development. In other words, as the workhorse for developing methods, best choice could be to use 150 mm x 4.6 mm, 5-m dp column. Normally, a mobile phase flow rate of 1.5 mL/min is advisable when running these columns.
Another important factor that has profound influence on chromatographic separation is mobile phase components, the organic and aqueous phase.
Organic solvent
The choice of the organic solvent is another factor that might affect how well the separation goes. Three options are available with reversed-phase separations: methanol (MeOH), acetonitrile (ACN), and tetrahydrofuran (THF). Each solvent offers a distinct advantage in terms of selectivity, but chromatographers rarely know which solvent will be the best option based on this factor. Thus, you must base your decision on other factors when selecting the starting solvent.
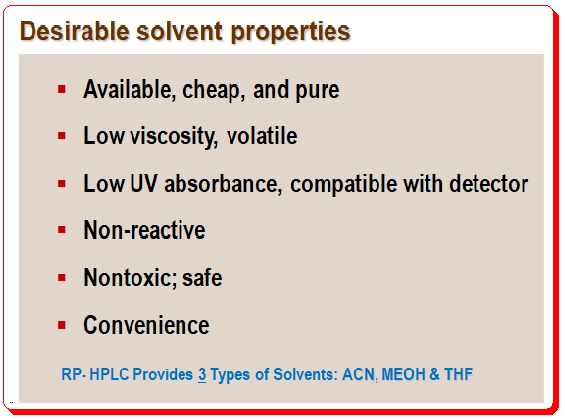
Majority of the work involves analyzing pharmaceutical compounds. Due to the extremely low UV absorbance of many of these samples, analysts frequently find themselves using detector settings of 220 run or less. Tetrahydrofuran has a high background absorbance, making it less useful below 240 nm. Gradients containing methanol typically drift off scale at wavelengths shorter than 220 nm, despite the fact that low concentrations of methanol can be used at low wave lengths. Further, You need a solvent that won’t react with the atmosphere or the samples. When using tetrahydrofuran, workers must exercise caution because it can break down and produce peroxides. According to some researchers, diluting tetrahydrofuran with water significantly reduces this issue. Tetrahydrofuran also takes much longer than acetonitrile or methanol to equilibrate with the column and LC system; initial equilibration with tetrahydrofuran may require twice as much solvent volume. Of course, the noxious smell of tetrahydrofuran is another drawback.
One more advantageous characteristic of acetonitrile and methanol is their lower back pressure when compared to tetrahydrofuran at flow rates of 1-2 ml/min. Acetonitrile is the first choice for an organic solvent that has the various desirable solvent properties, such as low viscosity, low UV absorbance, low reactivity, and convenience. Methanol is the alternate choice of solvent to start with.
Aqueous phase
If the samples are neutral compounds, using water as the aqueous phase might be possible. Ionic compounds are, however, frequently used in pharmaceutical analysis and numerous other applications. To obtain reproducible methods, analysts must maintain pH control when working with ionic compounds. Fully protonated or fully ionized compounds will yield the best results. Therefore, the mobile phase’s pH should, if at all possible, be at least 1.5 units above or below the pKa. Working at pH values lower than 3 is typically satisfactory for organic acids. But bases will need buffers with pH values greater than 8, which exceeds the working pH of the majority of silica-based columns. It is advisable to use organic buffers to prevent silica from dissolving. Hence it is it is important not to employ high-pH mobile phases with silica columns on a regular basis.
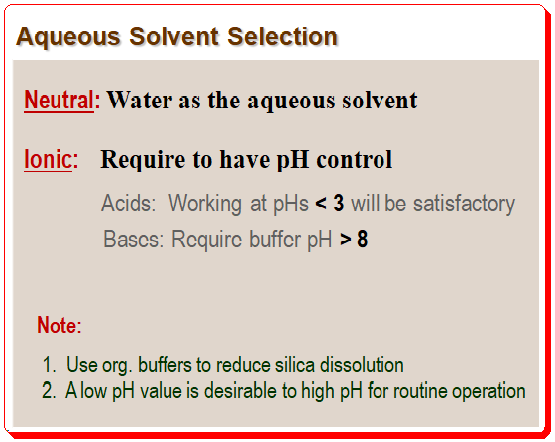
According to sample properties and pH stability of the column, a low pH is more practical than a high pH for routine operation. Most C8 and Cl8 columns maintain their stability down to a pH of about 2. Most acidic samples will be protonated under these circumstances, bases will be fully ionized, and surface silanol ionization will be at a minimum. 25 mM phosphate buffer at pH 2.5 will work well as the starting aqueous phase for many common procedures. You must use a volatile buffer if the method is meant to be used with a mass spectrometer. For many LC-mass spectrometry applications, 0.1% trifluoracetic acid or formic acid will provide adequate pH control, despite not being as useful as true buffers.
Other variables – Temperature, Additives
Before beginning to develop a new LC method, there are a few other things you should take into account. Controlling the column temperature is crucial because retention varies by 1-3% for every 1°C change in temperature. Selectivity can also be impacted by temperature changes, which should provide you with yet another reason to keep the temperature under control. In order to control the temperature and lower the solvent viscosity for lower-pressure operation, it is good to operate the column oven at a temperature that is just above room temperature (for instance, at 35 °C).
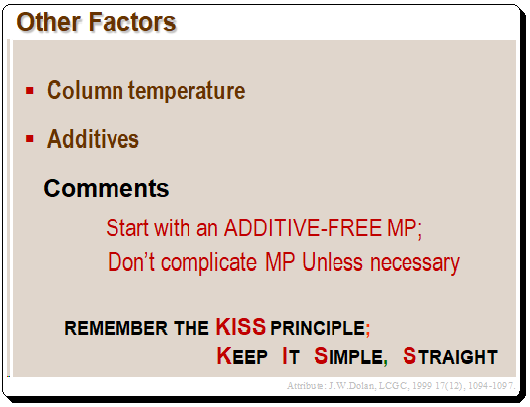
For particular sample types, you may occasionally need to use extra reagents like triethylamine or ion-pairing reagents. However, it is preferable to start with an additive-free mobile phase unless you are certain that you will need these additives. Follow the principle “Keep It Simple, Straight, and avoid overcomplicating the mobile phase unless absolutely necessary.
Summary
- Select a column that will be available for years to come
- Use a reputed column vendor/supplier who can consistently deliver controlled column chemistry, in your opinion.
- Pickup the starting conditions judiciously; Keep the method simple and straight
The Table below provides a summary of suggested starting conditions for reversed-phase HPLC method development. The 150 mm X 4.6 mm, 5-m dp Type B silica column is a workhorse, and when used with the majority of samples at low pH and under controlled temperature, it will be a great place to start method development.
For a detailed treatment of any of the above concepts consult books/articles suggested in the “Further reading” section.
Disclaimer
Due to the field’s quick development, there may have been some unintentional omissions or inadequate technical specifications. If any omissions or updates needing to be made are added, we would be pleased to include them. To draw attention to it, kindly write a comment. All technical specifications found here are reproduced as-is from the manufacturer’s literature and might have changed at the time of publication. All information given here is for furthering science and cannot be construed as professional advice.
Further reading
Lloyd R. Snyder, Joseph J. Kirkland, Joseph L. Glajch, Practical HPLC Method Development, pages. 600-615, 1997, John Wiley & Sons, Inc. ISBN 0-471-00703-X
John W. Dolan, LCGC, 1999 17(12), 1094-1097.
John W. Dolan and Lloyd R. Snyder, Troubleshooting LC systems: A comprehensive approach to troubleshooting LC equipment and separations, 1989, Humana Press, Inc., New Jersey. ISBN 0-89603-151-9.
Montgomery, D. C. Design and Analysis of Experiments, 2019, John Wiley and Sons, New York. ISBN: 978-1-119-49244-3
Henrik Rasmussen (Editor), Satinder Ahuja (Editor), HPLC Method Development for Pharmaceuticals: Volume 8 (Separation Science and Technology), 2007, Academic Press Inc, ISBN-13 : 978-3527331291

Dear Dr. Vinodhini,
Glad you find it informative.
Ion-pair chromatography (IP) is a HPLC technique frequently employed for the separation of analytes that contain ionizable or strongly polar groups, which lead these compounds to have a poor retention on hydrophobic columns (viz. C18, C8). TEA, TFA are examples of ion-pair reagents. Any standard book on HPLC method development will provide details on ion-pair chromatography. I would appreciate if you could consult any of them.
As far as the Fishbone diagram and ion-pair reagent, you could place them under the special additives category in the Mobile phase component (chemical factors).
Best regards,
Controlling and monitoring of Critical quality attributes related to HPLC method is useful information for all. Thank you sir